< Resources

Anomaly detection in WAAM

Real-time multi-sensor anomaly detection in Wire Arc Additive Manufacturing

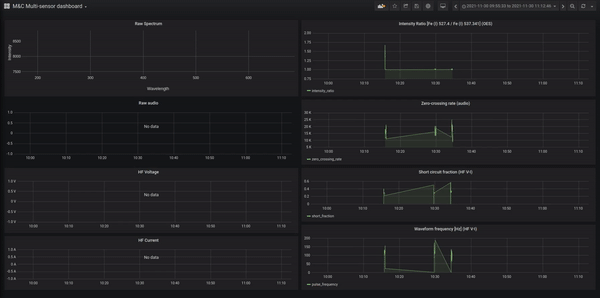
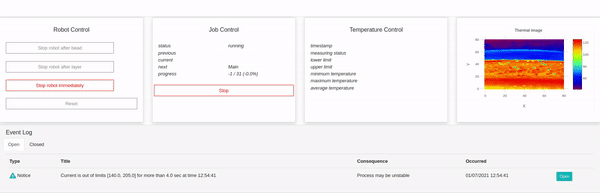
In this article, we introduce the real-time multi-sensor anomaly detection module as part of RAMLAB’s MaxQ. We take a deeper look at the different sensors integrated into the system and elaborate on its features that can be customized to industrial as well as research applications.

Introduction

Mechanical testing, failure analysis and microstructure investigation is done after a prototype or a component is fully made in many manufacturing processes. The probability of building a defective part increases when the manufacturing process has not been monitored and controlled – even if optimal conditions were used. For some processes, intensive labour requirements can introduce human error or unintentional mistakes. As a result, the quality of the product is highly dependent on the skill of the worker. Manufacturing defective parts can lead to the wastage of materials, excess power consumption, increase in manufacturing time, and higher production costs. This becomes critical in metal 3D printing of industrial components.

RAMLAB has been working on the automation of the robotic Gas Metal Arc Welding based Wire and Arc Additive Manufacturing (WAAM) process and building smart monitoring and control systems for several years. Real-time anomaly detection during the manufacturing process is an important step towards achieving the goal of first time right manufacturing, which can save time and money. The captured anomaly can be categorized and labeled for different types of defects that alerts the operator to take proper corrective measures. This not only saves money and material but can also improve the quality and uniformity of the part.

With sufficient statistical data analysis and evaluation on the sensor signals, reliable and robust feedback control systems can be built to dynamically adjust process parameters that help to mitigate, compensate or even eliminate the anomalies. These monitoring systems are developed based on the detection of a physical parameter that is known to influence the formation of a defect.

Figure 1: Schematic representation of the multi-sensor anomaly detection infrastructure
At RAMLAB, we are developing a multi-sensor anomaly detection system that can be used to identify anomalies during 3D metallic deposition using WAAM. It also serves as a platform to assist researchers in exploring new features and hidden correlations, as well as the convenience of attaching new types of sensors for in situ analysis.

The current infrastructure of the system is shown in Figure 1, which schematically represents the detection of anomalies in the following steps:

  • Data synchronization and acquisition
  • Feature extraction
  • Anomaly detection
  • Corrective actions

Data acquisition

The multi-sensor system currently consists of the following sensors:

  • High resolution U/I sensor: an interface board developed in-house that captures current and voltage waveforms at a sampling rate of 50 kHz
  • Spectrometer: a HR4000+ sensor from OceanOptics with a resolution of 0.135 nm to collect the optical emission spectrum from the plasma arc
  • Microphone: a standard Devine microphone with a sampling rate of 44.1 kHz (figure 3)
  • Camera: A C300 Cavitar welding camera for validation and melt pool visualization.

The data streams from these sensors are synchronized with time-stamps and saved in a backend database server together with data from the welding robot such as position coordinates, welding parameters and program details. These data streams are further processed in real-time and displayed in a dashboard to identify useful features that are sensitive to manufacturing anomalies. An example of the real-time sensor stream dashboard is shown in Figure 2.

Figure 2: Grafana dashboard to visualize synchronized raw data and selected features from multiple sensors
Figure 3: Setup with Devine microphone in the front and the optic fiber connected to the HR4000+ spectrometer in the background

Feature computation and anomaly detection

Statistical features are extracted from the raw data stream of each sensor. Some of these features are sensitive to inhomogeneities in the metal deposition and were selected for evaluation based on the published scientific literature, which aids us in our internal R&D. Different sensors are sensitive to different anomalies during the deposition process, i.e.,

  • The raw data from the U/I sensor tracks the current and voltage waveforms, which primarily determine the quality of metal transfer from the wire to the substrate. Features extracted from this data are thus sensitive to inhomogeneities in the metal transfer process that can result in geometrical defects. An example of gas flow rate influence on the waveform is shown in Figure 4.
  • The audio data from the microphone simulates the actions of a skilled welder who correlates the quality of the weld and process stability with the sound produced during the process. The used features are sensitive to the frequency and amplitude, and vary during the metallic deposition and used for detecting anomalies.
  • The optical emission spectrometer detects the light emitted from the plasma arc and melt pool. Features like intensity ratio, plasma temperature and line-to-continuum ratio are computed. These features are sensitive to the stability of the arc as well as the geometry of the deposited bead and metallic bonding.
  • The C300 Cavitar welding camera is used as a vision tool to validate the anomaly occurring during deposition to minimize the false positives from other sensor data streams. A software tool to trace the melt pool shape is currently under development. An example of tracking the shape of the melt pool using the software tool is shown in Figure 5.

In addition, the MaxQ system at RAMLAB is equipped with a Zivid 3D scanner and an Optris thermal camera. The scanner can also be useful for assisting in detecting surface defects per layer. The Optris thermal camera can help in different test environments where temperature is a factor which induces the anomaly.

Figure 4: Difference in U/I feature waveform frequency (number of current/voltage waveforms in 1 second) when the shielding gas flow is reduced. This can be used to detect blocked gas cap that results in porosity
Figure 5: Left: Raw footage from Cavitar welding camera      Right: Tracking the shape of the melt pool using our software tool developed in house

Corrective action

The multi-sensor system currently serves as a monitoring tool for the robot operator to diagnose the homogeneity and stability of the printing process. Feature limits can be set, where the operator gets alerted when a certain feature exceeds the set threshold. This can facilitate necessary interventions where the process parameters are modified or even stop the process if necessary. An example of error handling using the multi-sensor system is shown in Figure 6.

Our long term vision of the anomaly detection system is to have a self correcting process that is feedback controlled from the multi-sensor data streams. Such a process would dynamically adjust process parameters based on feedback from the anomaly detection module and enable fully automated printing of quality parts without human intervention. 

Figure 6: Error handling and reporting of anomalies in data stream

Conclusion

WAAM is a complex process where the quality of production depends on a variety of environmental and processing conditions. Such a process is prone to the presence of imperfections and defects. The defects such as cracking and lack of fusion can lead to the rejection of the printed part, unless necessary corrective actions are taken during manufacturing to prevent defects from occurring.

With the addition of the real-time multi-sensor anomaly detection in RAMLAB’s MaxQ system, it aims to manufacture quality metallic parts with a high level of process automation and reduce the presence of manufacturing defects. By taking necessary corrective actions waste reduction in material, power and time can be achieved. 

As mentioned above, RAMLAB MaxQ system is also an ideal platform for universities and institutions that want to perform research on WAAM, welding and cladding. The data from the sensor suite is time-stamped and integrated at the backend. It can be easily exported to study correlations between processing conditions and sensor signals. The system also offers the capability of computing custom features using the sensor data streams in real-time.  

Learn more about MaxQ

Speak to an expert

Want to know more about anomaly detection in WAAM? Leave your details, and we will be in contact shortly.